U.S. hotel occupancy rose in the first week of 2026
CoStar data showed higher occupancy, room rates and RevPAR for U.S. hotels, though Calculated Risk cautioned early January is hard to read.
By Sofia Marchetti · Columnist
· 2 min read
U.S. hotels opened 2026 with better year-over-year numbers, a small positive signal for investors watching travel demand, lodging operators and the broader consumer economy. The catch: early January is a quiet travel period, so one week of data can give a noisy read on the industry’s direction.
CoStar’s STR data showed U.S. hotel occupancy at 50.5% for the week of Dec. 28, 2025, through Jan. 3, 2026, up 4.4% from the comparable week a year earlier. Occupancy is the share of available rooms that were actually filled, so it is one of the clearest gauges of how many people are booking hotel stays.
The industry also reported stronger pricing. CoStar said average daily rate, or ADR, was $175.47 for the week, up 3.4% year over year. ADR measures the average room price paid by guests, excluding the effect of empty rooms.
Revenue per available room, known as RevPAR, rose 7.9% to $88.65, according to CoStar. RevPAR combines occupancy and pricing into one metric: it shows how much revenue hotels generated for each room they had available, whether or not that room was booked. That makes it a widely watched measure because a hotel can lift RevPAR by filling more rooms, charging higher prices, or both.
Calculated Risk said hotel occupancy was weak in 2025 and warned that it is difficult to judge performance this early in the calendar year. Travel demand is usually soft in early January, which can make week-to-week movements look more dramatic than the broader trend.
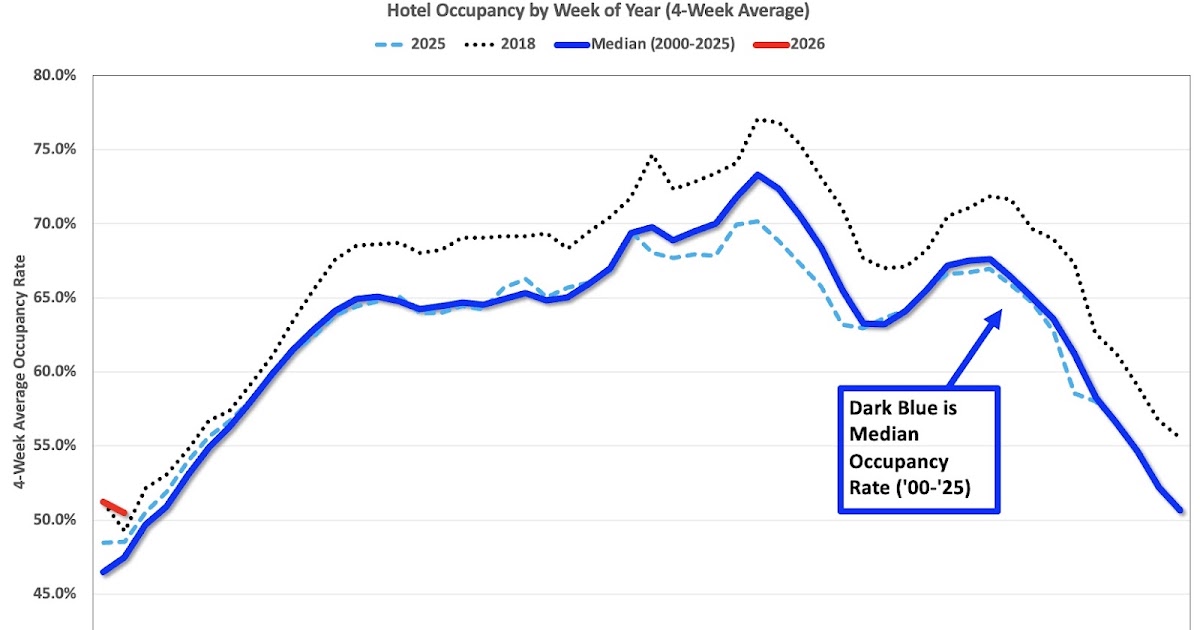
The site also highlighted the seasonal pattern in hotel occupancy using a four-week average. That kind of average smooths out weekly volatility by taking the latest four weeks together, giving readers a cleaner view of the trend. Calculated Risk said the four-week average is expected to rise seasonally over the next few months.
Calculated Risk’s chart compared 2026 with historical benchmarks, including the median occupancy pattern, 2025 and 2018. The site identified 2018 as the record year for hotel occupancy. It also noted that the chart’s y-axis does not start at zero, a choice meant to show seasonal changes more clearly.
For retail investors, the takeaway is measured. The latest CoStar data show that hotels began the year with higher occupancy, higher room rates and stronger RevPAR than the same week a year earlier. Calculated Risk’s caution is just as relevant: the first week of January is not enough to call a sustained recovery or slowdown in travel demand.
This story draws on original reporting from Calculated Risk.