Mag 7 stocks are no longer carrying the S&P 500 in 2026
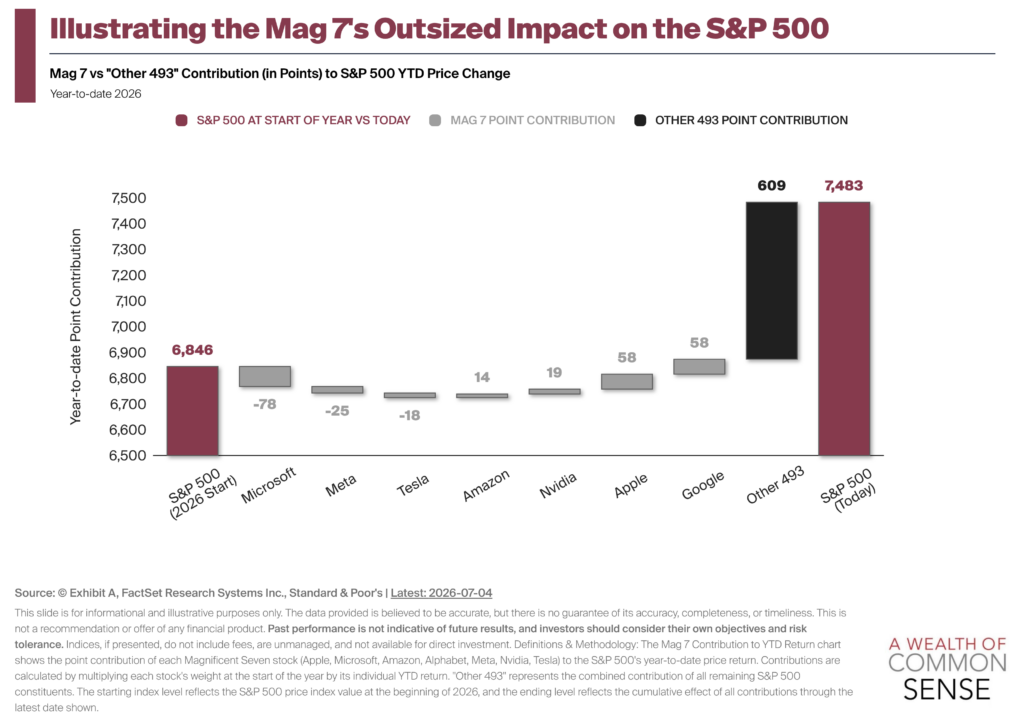
Charts cited by A Wealth of Common Sense show the S&P 493 producing about 96% of the index’s price-only return this year.
By Sofia Marchetti · Columnist
· 3 min read
The market’s leadership has shifted in 2026, and the biggest tech names are no longer doing most of the work for the S&P 500. For everyday investors, that matters because a portfolio that looked diversified on paper could still have depended heavily on a handful of mega-cap stocks in recent years.
A Wealth of Common Sense, citing charts from Exhibit A, said the so-called Mag 7 has lagged both the full S&P 500 and the S&P 493 so far this year. The S&P 493 refers to the rest of the S&P 500 after excluding those seven dominant mega-cap tech companies.
According to the Exhibit A chart cited by A Wealth of Common Sense, the S&P 493 has generated around 96% of the S&P 500’s price-only return this year. Price-only return measures stock-price changes and excludes dividends.
Broad market strength is doing more of the lifting
The recent setup is a reversal from much of the past decade, when mega-cap tech stocks often delivered the strongest returns and pulled major indexes higher. A Wealth of Common Sense described that long stretch as a period when the largest and best-known tech companies often were also among the best investments.
The 2026 picture looks different. A company-level breakdown cited by A Wealth of Common Sense showed Microsoft, Meta and Tesla subtracting from the S&P 500’s performance this year. The same post said six of the seven Mag 7 stocks were in double-digit drawdowns, meaning they had fallen at least 10% from a prior peak.
That does not mean the broad index has been weak. The point made in the charts is that gains have come from outside the most crowded group of mega-cap leaders. Smaller companies have also beaten larger companies this year, according to a comparison of IWM, an exchange-traded fund tracking small-cap stocks, and SPY, an exchange-traded fund tracking the S&P 500, cited by A Wealth of Common Sense.
Why the rotation matters
Charts from Chart Kid Matt, cited in the same analysis, showed that U.S. stocks across various market-cap and style categories have been outperforming the Mag 7 this year. Market cap, short for market capitalization, is a company’s stock-market value. Style categories usually separate stocks by traits such as growth or value.
A Wealth of Common Sense said it does not know whether this shift will continue. The post also raised the possibility that investors may be penalizing the largest cloud and artificial intelligence infrastructure companies for spending free cash flow more aggressively. Free cash flow is the cash a company has left after paying for operations and capital spending.
The broader takeaway from the analysis is about concentration risk. When a small group of stocks dominates returns for years, investors may start to question the value of owning anything else. The 2026 performance data cited by A Wealth of Common Sense shows how quickly leadership can spread beyond the prior winners.
For retail investors, the lesson is less about calling the next leader and more about understanding what an index actually owns. A market-cap-weighted index gives more influence to the largest companies, so their gains or losses can have an outsized effect. In 2026, according to the charts cited, the rest of the market has been doing most of the heavy lifting.
This story draws on original reporting from A Wealth of Common Sense.