Most expensive housing markets are led by Hong Kong and Sydney
Hong Kong and Sydney top Demographia’s 2026 affordability ranking, where typical home prices are about 14 times household income.
By Priya Nair · Economy Reporter
· 3 min read
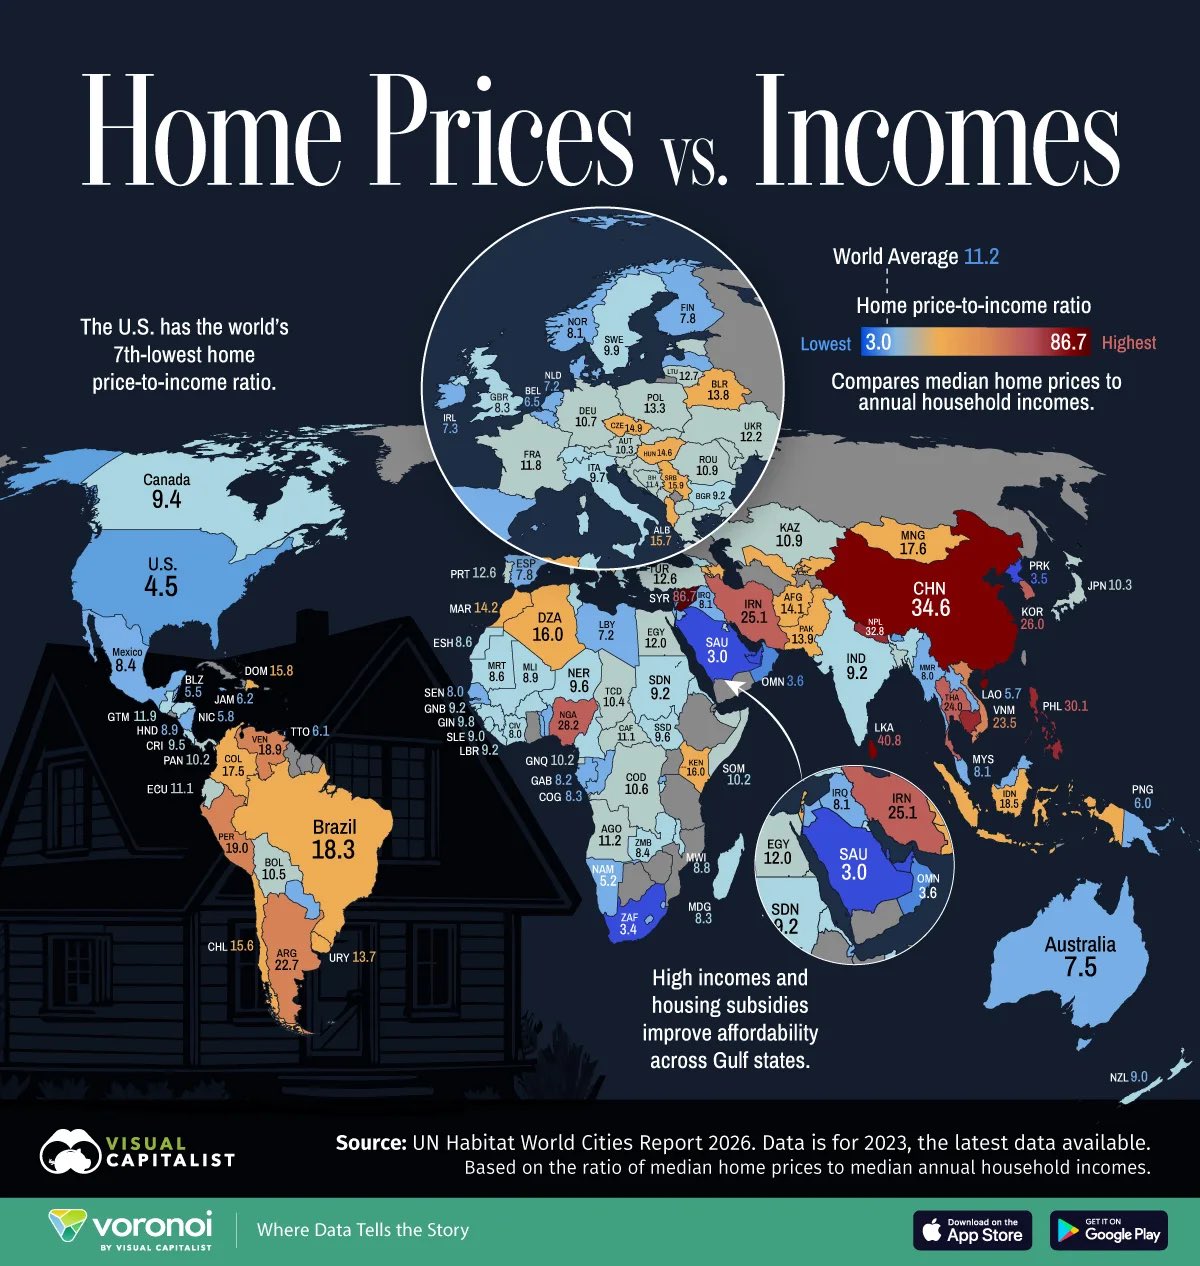
The most expensive housing markets, measured by home prices relative to local incomes rather than by dollar prices alone, are Hong Kong and Sydney. For a prospective buyer, that distinction matters: a lower-priced home can still be less affordable if household incomes are lower.
The 2026 Demographia International Housing Affordability report ranks Hong Kong first among the least-affordable metropolitan markets, followed closely by Sydney. The report was published by the Frontier Centre for Public Policy with Chapman University’s Center for Demographics and Policy. It covers 95 major metropolitan markets in eight countries using data from the third quarter of 2025.
What are the most expensive housing markets relative to income?
Demographia uses a measure called the median multiple: the median house price divided by median household income. A higher multiple means a typical home costs more relative to what a typical household earns, which points to lower housing affordability.
- Hong Kong: 14.1
- Sydney: 14.0
- San Jose: 11.3
- Adelaide: 11.2
- Vancouver: 10.8
- Los Angeles: 10.7
- Honolulu: 10.4
- Brisbane: 9.9
- Melbourne: 9.5
- San Francisco: 9.4
All 10 markets fall into the report’s “impossibly unaffordable” category, defined as a median multiple of 9.0 or higher. Demographia labels markets affordable at 3.0 or below; moderately unaffordable from 3.1 to 4.0; seriously unaffordable from 4.1 to 5.0; and severely unaffordable from 5.1 to 8.9.
Which U.S. markets are least affordable?
Four U.S. metropolitan areas make the global top 10: San Jose, Los Angeles, Honolulu and San Francisco. San Jose ranks third overall, with a typical home priced at 11.3 times median household income under the report’s measure.
The same comparison also shows a wide range in price-to-income affordability across U.S. markets. Cleveland had the lowest median multiple, and was the most affordable market, in the cited comparison, at 3.1. Pittsburgh followed at 3.2, while Oklahoma City, Rochester and St. Louis each registered 3.6.
Those figures do not mean Cleveland has the cheapest homes in dollar terms. They show that, within this comparison, local home prices were lower relative to local household incomes than in the other markets surveyed.
Why “most expensive” needs a definition
Rankings can produce different answers depending on whether they measure sale prices, rent, household income or a combination of those factors. U.S. News, for example, places Westminster, California, first in its separate list of most expensive places to live, followed by Newport Beach and San Rafael. Its supplied ranking includes median home values, rents and household incomes, but does not provide a methodology that makes it comparable with Demographia’s median multiple.
The Demographia results are therefore best read as a comparison of purchase affordability for a typical household in selected metro areas, rather than a league table of the world’s highest-priced homes or rents. The report publisher argues that restrictive land-use regulation is generally associated with worse affordability, though the material available here does not independently establish that as a causal finding.
For readers comparing markets, the practical takeaway is to look past a home’s sticker price and compare it with local incomes, as well as the particular costs and supply conditions in the area being considered.
This story draws on original reporting from A Wealth of Common Sense.