S&P 500 7500 level becomes options market fault line
Options positioning around the S&P 500 7500 area is keeping traders focused on whether a break lower could accelerate selling.
By Dev Ramirez · Crypto Correspondent
· 3 min read
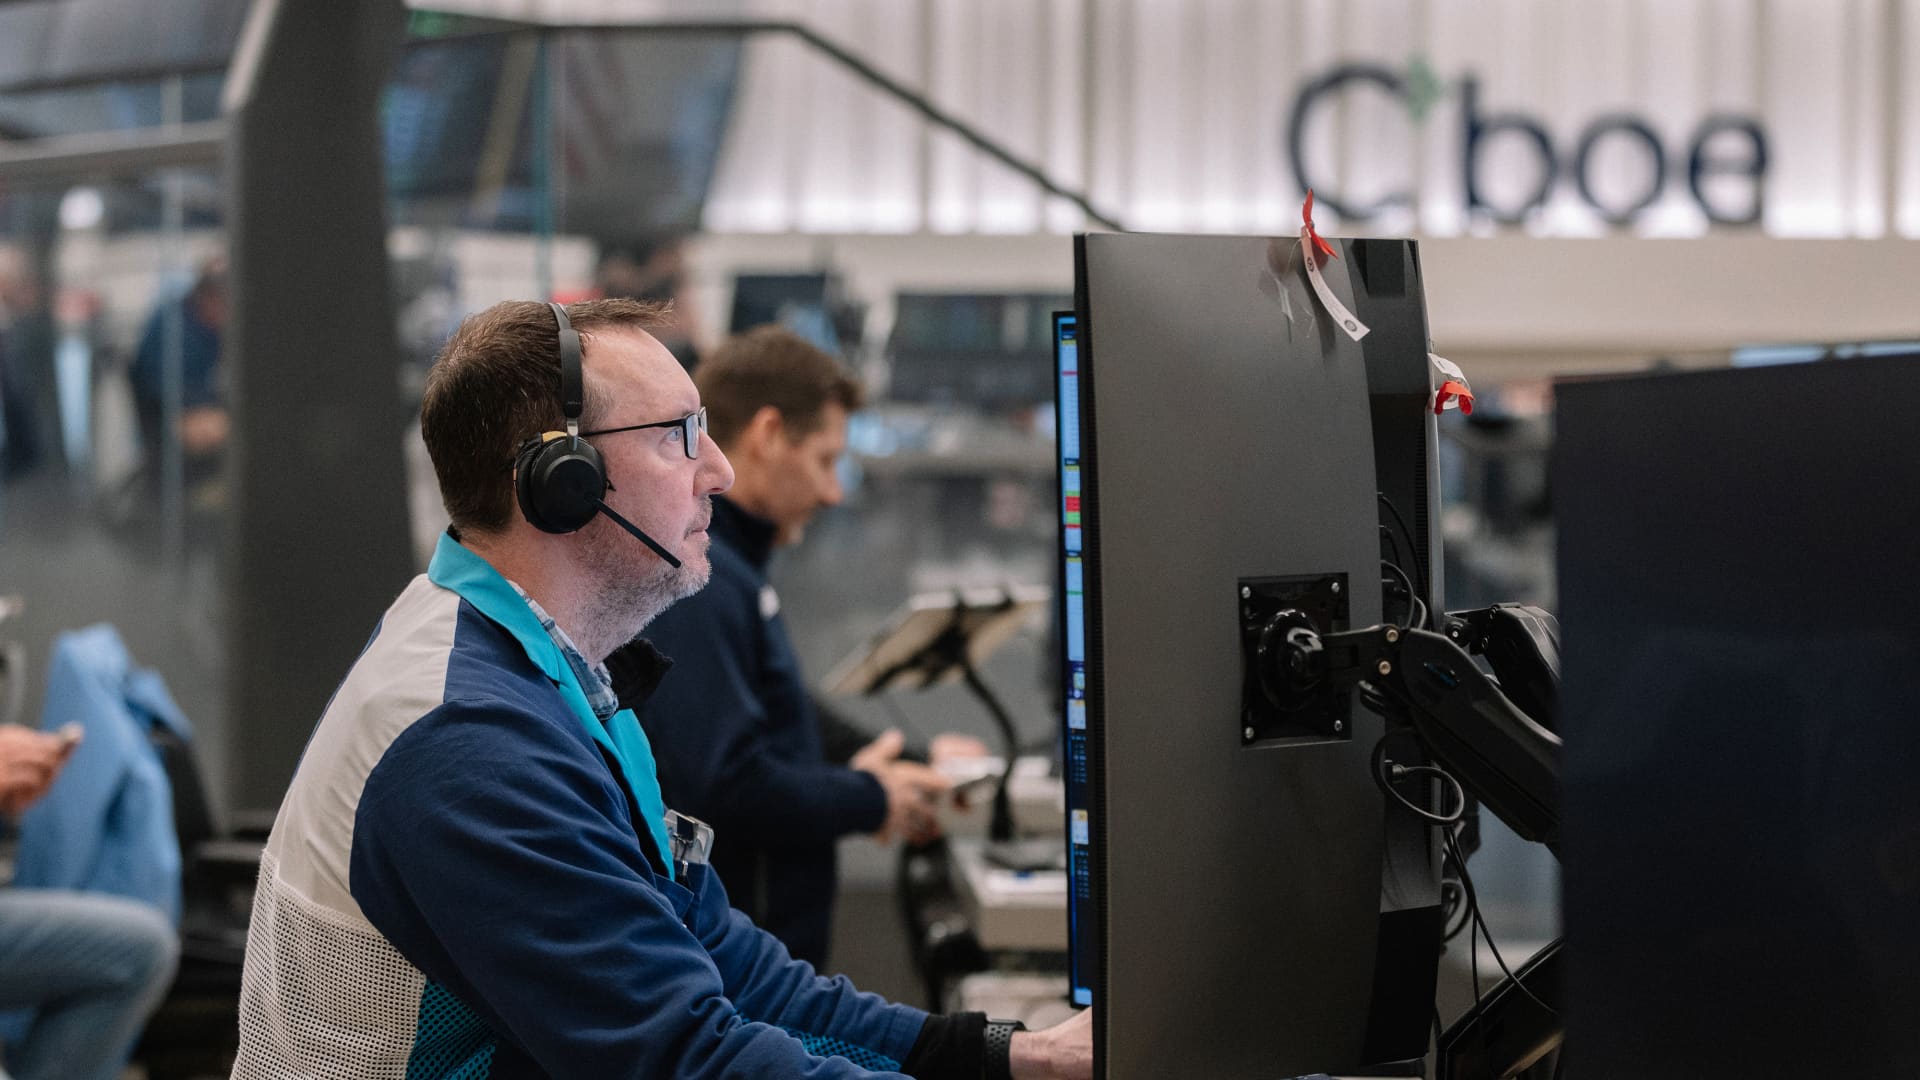
The S&P 500 7500 area has become the market’s near-term line to watch after two choppy sessions, with options data suggesting that a move too far below it could make swings sharper. For everyday investors, that matters because options dealers can affect short-term index moves as they hedge their exposure, especially near heavily traded strike prices.
CNBC reported that traders and market makers in Chicago bought dips below 7,500 in the S&P 500 on Friday, while rallies above that level met selling. The index was recently quoted at 7,483.72, up 46.09 points, or 0.62%, at 2:26 p.m. EDT, according to CNBC market data.
Barchart data cited by CNBC showed the largest combined open interest in puts and calls at the 750 strike on the SPY ETF. Open interest is the number of outstanding options contracts that have not been closed or exercised. SPY is an exchange-traded fund tied to the S&P 500, so activity in its options market can give clues about where traders are concentrated.
What happens if the S&P 500 breaks below 7450?
SpotGamma and Barchart data cited by CNBC pointed to 745 on SPY, near 7,450 on the S&P 500, as a level where dealer hedging may stop damping volatility. In options terms, that zone is where the market can move into “negative gamma,” a setup in which dealers’ hedging can add pressure in the direction the market is already moving instead of smoothing it out.
That matters after Wednesday’s drop, when the S&P 500 fell to its lowest level since mid-June following the Fed meeting, according to CNBC. Brent Kochuba, founder of SpotGamma, wrote in a Friday client note cited by CNBC that if the S&P 500 breaks below 7,450, his firm would look for a larger move lower. Kochuba also said selling short-dated calls around the 7,520 strike on the S&P 500 looked appealing, according to CNBC.
The options setup is only one part of the story. CNBC also pointed to a broader split inside the stock market, where AI-related technology shares have separated from weaker sectors for months. That division has shown up in Cboe’s 1-month implied correlation index, a measure of how closely the largest S&P 500 stocks are expected to move together over the next month.
The index fell to 3.3 on July 10, which CNBC said was an all-time low. A very low reading can signal a market where a few winners are carrying the index while many other stocks behave differently. Since then, the measure has climbed above 12 after Wednesday’s sell-off and Thursday’s broad rally, suggesting participation has widened.
CNBC reported that the S&P 500’s Wednesday decline produced only one 52-week low among index members, another sign that the sell-off was not widespread across the full benchmark. Still, the correlation index rose much higher during prior pullbacks before the market found a bottom, reaching 20 in June and 45 in April, according to CNBC.
For investors watching index funds, retirement accounts or options-heavy trading in SPY, the takeaway is that 7,500 is more than a round number for now. It is a crowded area in the options market, and the next break away from it may depend on whether dealer hedging continues to stabilize the index or starts to amplify the move.
This story draws on original reporting from CNBC.