Market’s best days often arrive near its worst ones
A Wealth of Common Sense analysis says Bob’s buy-and-hold success came from time in the market, not from dodging volatility.
By Sofia Marchetti · Columnist
· 3 min read
A popular investing lesson is getting a sharper explanation: the market’s strongest daily gains often show up near its ugliest drops. For everyday investors, that means jumping out during a selloff can also mean missing the rebound days that do a lot of work in long-term returns.
A Wealth of Common Sense revisited its “Bob, the World’s Worst Market Timer” example, a parable about an investor who repeatedly bought at market peaks but did not sell. The point of that story was that compounding, the process where investment gains can earn their own gains over time, can still work even when entry points are poor if the investor stays invested for long enough.
The new analysis addressed how that lesson fits with a commonly cited market statistic: missing a small number of the best trading days can severely reduce returns. A chart from JPMorgan cited by A Wealth of Common Sense shows that missing the 10 best days would cut annual returns by 40%. Missing the 30 best days leaves returns at only a fraction of the long-term average, according to the same analysis.
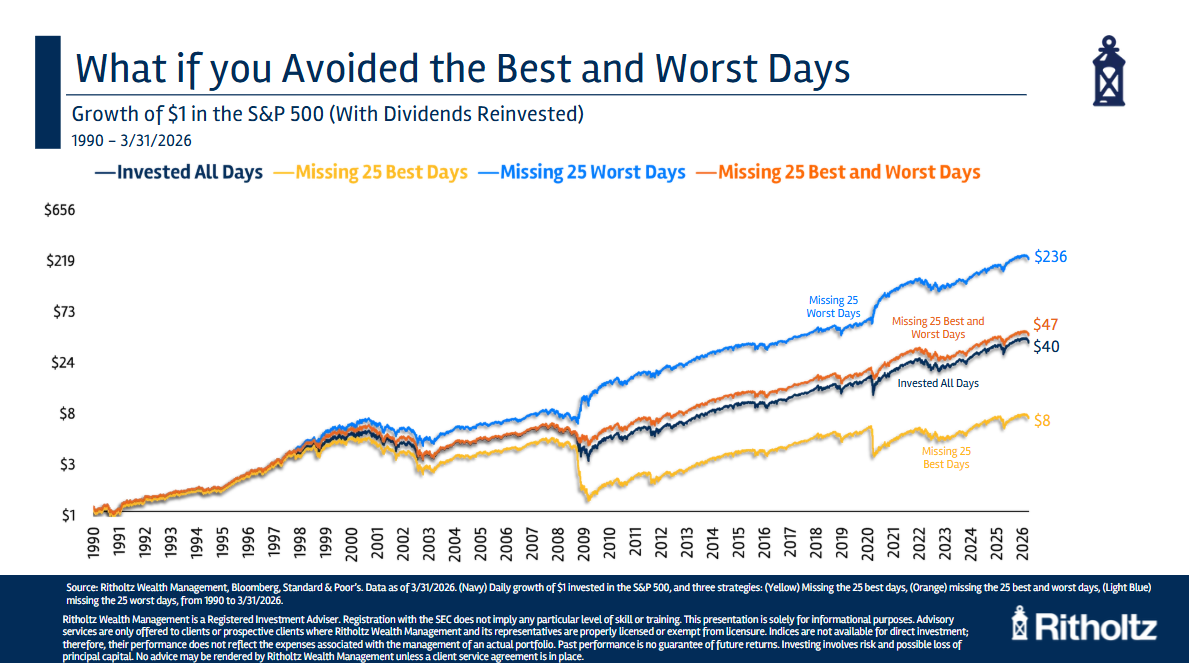
Another example in the analysis looked at $1 invested since 1990. If the investor stayed fully invested, that dollar grew to $40. If the investor missed the 25 best days, it grew to only $8. If the investor somehow avoided the 25 worst days, it grew to nearly $240. If the investor missed both the best and worst days, the result looked close to long-term buy-and-hold growth, according to A Wealth of Common Sense.
Why the best and worst days cluster
The catch is that the best and worst days are not spread neatly across calm markets. A chart from Exhibit A cited in the analysis shows that major up and down days since 1990 were concentrated around the dot-com bust, the 2008 financial crisis, the Covid crash and the 2022 inflation-driven bear market.
A Wealth of Common Sense said that clustering happens because volatility tends to feed on itself. Volatility means bigger price swings, and during selloffs those swings can be amplified by investor emotion, uncertainty and the fact that losses often feel more painful than gains feel rewarding.
The analysis also pointed to market mechanics. Forced selling, margin calls and profit-taking can accelerate declines. A margin call happens when a broker requires an investor to add cash or sell assets after borrowed-money trades move against them. Rebounds can also be sharp, driven by short covering, bargain hunting, relief rallies and hopes for a policy response, according to the analysis.
That is the problem with trying to avoid only the bad days. The days investors most want to skip often sit close to the days they most need to capture.
What saved Bob
A Wealth of Common Sense concluded that Bob’s success did not come from buying before the market’s best rebound days. His advantage was his long time horizon. He bought at terrible moments, then sat through both the best days and the worst days that followed.
The analysis said this is why market timing becomes especially difficult during falling markets. Panic can push investors out near the same period when some of the strongest daily gains occur. The numbers do not prove that every investor should use the same strategy, but they show how costly mistiming a volatile stretch can be.
This story draws on original reporting from A Wealth of Common Sense.