U.S. household net worth rose $6.1 trillion in the third quarter
The Federal Reserve said household and nonprofit wealth hit $181.6 trillion as stock holdings gained and real estate values slipped.
By Maya Okafor · Markets Writer
· 3 min read
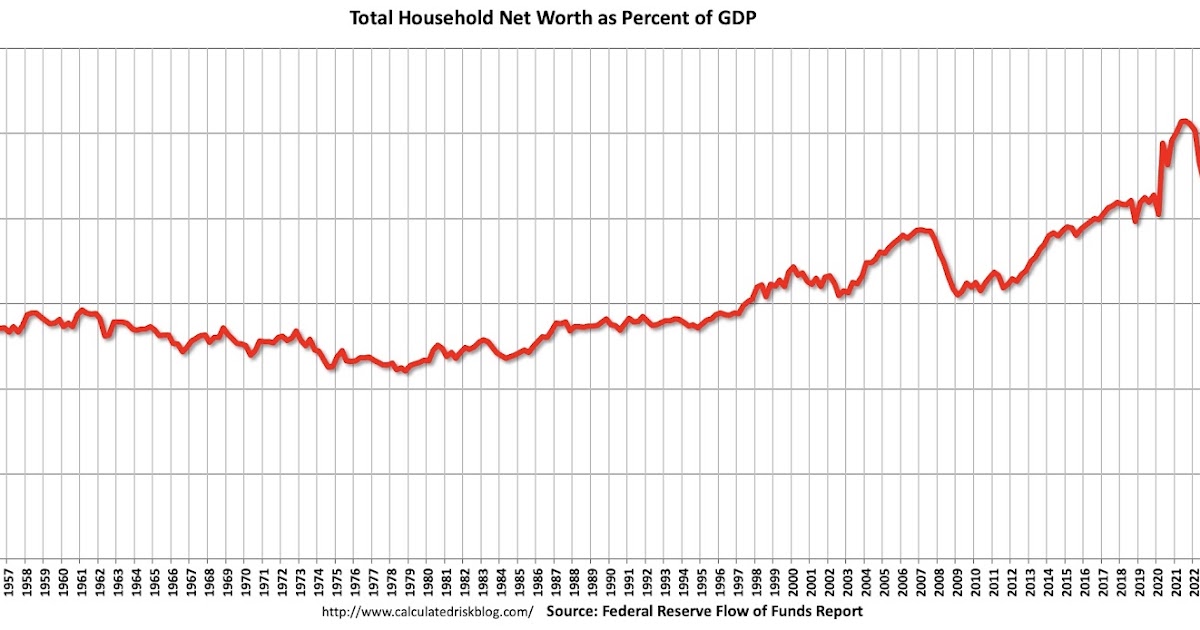
U.S. household and nonprofit net worth rose by $6.1 trillion in the third quarter of 2025, reaching $181.6 trillion, according to the Federal Reserve’s Financial Accounts of the United States. For retail investors, the report shows how much of the latest balance-sheet gain came from financial markets, while housing contributed less.
Net worth means assets minus liabilities. In this Fed report, assets include real estate and financial holdings such as stocks, bonds, pension reserves and bank deposits. Liabilities are mainly debts such as mortgages. Calculated Risk noted that the measure does not include public debt obligations.
The Fed said the value of corporate equities held directly and indirectly by households and nonprofits increased by $5.5 trillion during the quarter. “Indirectly” includes exposure through vehicles such as pension accounts or funds, rather than shares owned in a brokerage account.
Real estate moved the other way. The Fed reported that the value of real estate held by households and nonprofits fell by $0.3 trillion in the quarter, even as the overall wealth figure climbed.
Stocks lifted the wealth total
Calculated Risk said household and nonprofit net worth increased as a share of gross domestic product in the third quarter, though it remained below its 2021 peak. Gross domestic product, or GDP, is the broadest measure of U.S. economic output, so comparing wealth to GDP gives a sense of how large household balance sheets are relative to the economy.
The equity-driven increase is a reminder that changes in asset prices can move national wealth figures quickly. When stock values rise, retirement accounts, pensions and taxable portfolios can raise reported household wealth even without a matching increase in wages or savings.
That does not mean gains are evenly distributed. The Fed figures cited here describe the combined balance sheet of households and nonprofits, and the release does not break down who received the increase.
Debt kept growing, but mortgage leverage stayed lower versus GDP
Household borrowing also rose in the third quarter. The Fed said total household debt grew at a 4.1% annual rate. An annual rate shows what the pace would look like if the quarterly rate continued for a full year.
Consumer credit, which includes borrowing such as credit cards and auto loans, increased at a 2.3% annual rate, according to the Fed. Mortgage debt excluding charge-offs grew at a 3.2% annual rate.
Calculated Risk said mortgage debt increased by $108 billion in the third quarter. The site also said mortgage debt was $2.99 trillion above its housing-bubble peak, but looked much smaller when compared with the size of the economy: mortgage debt stood at 43.9% of GDP, down from the second quarter and far below the 73.1% peak reached during the housing bust.
Homeowner equity edged lower
Homeowner equity, measured as households’ ownership share of their real estate, was 71.6% in the third quarter, according to Calculated Risk’s reading of the Fed data. That was down from 72.0% in the second quarter of 2025.
The measure includes households without mortgage debt, which can make the overall equity share look stronger than it would for only homeowners with loans. Calculated Risk noted that household equity fell sharply during 2007 and 2008, when home prices declined.
Calculated Risk also said household real estate assets as a share of GDP declined in the third quarter. That ratio remained below its recent high from the second quarter of 2022, while staying above the median level of the past 30 years.
This story draws on original reporting from Calculated Risk.